Sports Betting Market Size 2025-2029
The sports betting market size is forecast to increase by USD 221.1 billion, at a CAGR of 12.6% between 2024 and 2029.
- The market is experiencing dynamic growth, driven by the digital revolution and the emergence of machine learning technologies. These advancements enable more accurate predictions and personalized betting experiences for consumers, creating a competitive edge for market participants. Popular betting options include football (soccer), basketball, tennis, horse racing, cricket, and various other sports events. However, this market landscape is not without challenges. Stringent government regulations and restrictions pose significant obstacles, requiring companies to navigate complex legal frameworks and comply with evolving policies.
- As the industry continues to evolve, staying informed of regulatory changes and adapting to technological advancements will be crucial for market success. Companies that effectively balance innovation and regulatory compliance will be well-positioned to capitalize on the growing opportunities in the market.
What will be the Size of the Sports Betting Market during the forecast period?
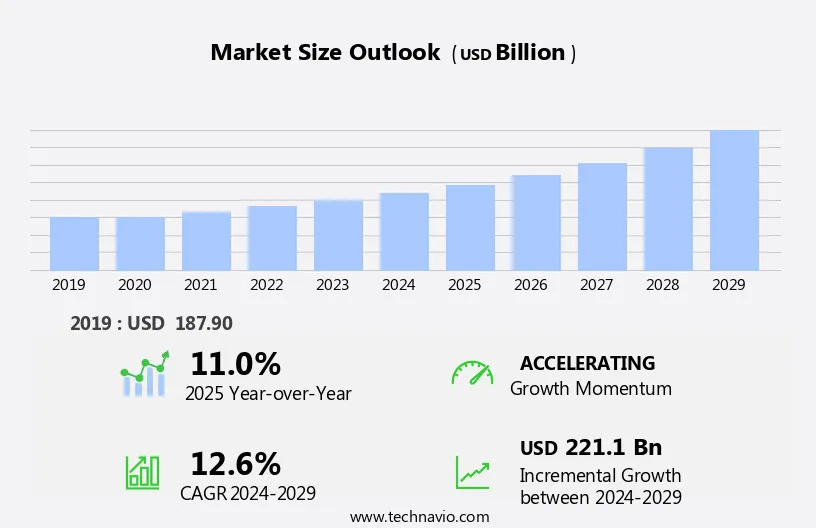
Explore in-depth regional segment analysis with market size data - historical 2019-2023 and forecasts 2025-2029 - in the full report.
Request Free Sample
1 Executive Summary
- 1.1 Market overview
- Executive Summary - Chart on Market Overview
- Executive Summary - Data Table on Market Overview
- Executive Summary - Chart on Global Market Characteristics
- Executive Summary - Chart on Market by Geography
- Executive Summary - Chart on Market Segmentation by Platform
- Executive Summary - Chart on Market Segmentation by Type
- Executive Summary - Chart on Incremental Growth
- Executive Summary - Data Table on Incremental Growth
- Executive Summary - Chart on Company Market Positioning
2 Technavio Analysis
- 2.1 Analysis of price sensitivity, lifecycle, customer purchase basket, adoption rates, and purchase criteria
- Analysis of price sensitivity, lifecycle, customer purchase basket, adoption rates, and purchase criteria
- 2.2 Criticality of inputs and Factors of differentiation
- Overview on criticality of inputs and factors of differentiation
- 2.3 Factors of disruption
- Overview on factors of disruption
- 2.4 Impact of drivers and challenges
- Impact of drivers and challenges in 2024 and 2029
3 Market Landscape
- 3.1 Market ecosystem
- Parent Market
- Data Table on - Parent Market
- 3.2 Market characteristics
- Market characteristics analysis
4 Market Sizing
- 4.1 Market definition
- Offerings of companies included in the market definition
- 4.2 Market segment analysis
- 4.4 Market outlook: Forecast for 2024-2029
- Chart on Global - Market size and forecast 2024-2029 ($ billion)
- Data Table on Global - Market size and forecast 2024-2029 ($ billion)
- Chart on Global Market: Year-over-year growth 2024-2029 (%)
- Data Table on Global Market: Year-over-year growth 2024-2029 (%)
5 Historic Market Size
- 5.1 Global Sports Betting Market 2019 - 2023
- Historic Market Size - Data Table on Global Sports Betting Market 2019 - 2023 ($ billion)
- 5.2 Platform segment analysis 2019 - 2023
- Historic Market Size - Platform Segment 2019 - 2023 ($ billion)
- 5.3 Type segment analysis 2019 - 2023
- Historic Market Size - Type Segment 2019 - 2023 ($ billion)
- 5.4 Geography segment analysis 2019 - 2023
- Historic Market Size - Geography Segment 2019 - 2023 ($ billion)
- 5.5 Country segment analysis 2019 - 2023
- Historic Market Size - Country Segment 2019 - 2023 ($ billion)
6 Qualitative Analysis
- 6.1 Impact of AI in the Global Sports Betting Market
7 Five Forces Analysis
- 7.1 Five forces summary
- Five forces analysis - Comparison between 2024 and 2029
- 7.2 Bargaining power of buyers
- Bargaining power of buyers - Impact of key factors 2024 and 2029
- 7.3 Bargaining power of suppliers
- Bargaining power of suppliers - Impact of key factors in 2024 and 2029
- 7.4 Threat of new entrants
- Threat of new entrants - Impact of key factors in 2024 and 2029
- 7.5 Threat of substitutes
- Threat of substitutes - Impact of key factors in 2024 and 2029
- 7.6 Threat of rivalry
- Threat of rivalry - Impact of key factors in 2024 and 2029
- 7.7 Market condition
- Chart on Market condition - Five forces 2024 and 2029
8 Market Segmentation by Platform
- 8.1 Market segments
- Chart on Platform - Market share 2024-2029 (%)
- Data Table on Platform - Market share 2024-2029 (%)
- 8.2 Comparison by Platform
- Chart on Comparison by Platform
- Data Table on Comparison by Platform
- 8.3 Online - Market size and forecast 2024-2029
- Chart on Online - Market size and forecast 2024-2029 ($ billion)
- Data Table on Online - Market size and forecast 2024-2029 ($ billion)
- Chart on Online - Year-over-year growth 2024-2029 (%)
- Data Table on Online - Year-over-year growth 2024-2029 (%)
- 8.4 Offline - Market size and forecast 2024-2029
- Chart on Offline - Market size and forecast 2024-2029 ($ billion)
- Data Table on Offline - Market size and forecast 2024-2029 ($ billion)
- Chart on Offline - Year-over-year growth 2024-2029 (%)
- Data Table on Offline - Year-over-year growth 2024-2029 (%)
- 8.5 Market opportunity by Platform
- Market opportunity by Platform ($ billion)
- Data Table on Market opportunity by Platform ($ billion)
9 Market Segmentation by Type
- 9.1 Market segments
- Chart on Type - Market share 2024-2029 (%)
- Data Table on Type - Market share 2024-2029 (%)
- 9.2 Comparison by Type
- Chart on Comparison by Type
- Data Table on Comparison by Type
- 9.3 Basketball - Market size and forecast 2024-2029
- Chart on Basketball - Market size and forecast 2024-2029 ($ billion)
- Data Table on Basketball - Market size and forecast 2024-2029 ($ billion)
- Chart on Basketball - Year-over-year growth 2024-2029 (%)
- Data Table on Basketball - Year-over-year growth 2024-2029 (%)
- 9.4 Horse riding - Market size and forecast 2024-2029
- Chart on Horse riding - Market size and forecast 2024-2029 ($ billion)
- Data Table on Horse riding - Market size and forecast 2024-2029 ($ billion)
- Chart on Horse riding - Year-over-year growth 2024-2029 (%)
- Data Table on Horse riding - Year-over-year growth 2024-2029 (%)
- 9.5 Football - Market size and forecast 2024-2029
- Chart on Football - Market size and forecast 2024-2029 ($ billion)
- Data Table on Football - Market size and forecast 2024-2029 ($ billion)
- Chart on Football - Year-over-year growth 2024-2029 (%)
- Data Table on Football - Year-over-year growth 2024-2029 (%)
- 9.6 Others - Market size and forecast 2024-2029
- Chart on Others - Market size and forecast 2024-2029 ($ billion)
- Data Table on Others - Market size and forecast 2024-2029 ($ billion)
- Chart on Others - Year-over-year growth 2024-2029 (%)
- Data Table on Others - Year-over-year growth 2024-2029 (%)
- 9.7 Market opportunity by Type
- Market opportunity by Type ($ billion)
- Data Table on Market opportunity by Type ($ billion)
10 Market Segmentation by Betting Type
- 10.1 Market segments
- Chart on Betting Type - Market share (2024-2029) (%)
- Data Table on Betting Type - Market share (2024-2029) (%)
- 10.2 Comparison by Betting Type
- Chart on Comparison by Betting Type
- Data Table on Comparison by Betting Type
- 10.3 Fixed Odds Wagering - Market size and forecast (2024-2029)
- Chart on Fixed Odds Wagering - Market size and forecast (2024-2029) ($ million)
- Data Table on Fixed Odds Wagering - Market size and forecast (2024-2029) ($ million)
- Chart on Fixed Odds Wagering - Year-over-year growth (2024-2029) (%)
- Data Table on Fixed Odds Wagering - Year-over-year growth (2024-2029) (%)
- 10.4 Exchange Betting - Market size and forecast (2024-2029)
- Chart on Exchange Betting - Market size and forecast (2024-2029) ($ million)
- Data Table on Exchange Betting - Market size and forecast (2024-2029) ($ million)
- Chart on Exchange Betting - Year-over-year growth (2024-2029) (%)
- Data Table on Exchange Betting - Year-over-year growth (2024-2029) (%)
- 10.5 Live/In-Play Betting - Market size and forecast (2024-2029)
- Chart on Live/In-Play Betting - Market size and forecast (2024-2029) ($ million)
- Data Table on Live/In-Play Betting - Market size and forecast (2024-2029) ($ million)
- Chart on Live/In-Play Betting - Year-over-year growth (2024-2029) (%)
- Data Table on Live/In-Play Betting - Year-over-year growth (2024-2029) (%)
- 10.6 eSports Betting - Market size and forecast (2024-2029)
- Chart on eSports Betting - Market size and forecast (2024-2029) ($ million)
- Data Table on eSports Betting - Market size and forecast (2024-2029) ($ million)
- Chart on eSports Betting - Year-over-year growth (2024-2029) (%)
- Data Table on eSports Betting - Year-over-year growth (2024-2029) (%)
- 10.7 Market opportunity by Betting Type
- Market opportunity by $segment_name ($ million)
- Data Table on Market opportunity by $segment_name ($ million)
11 Customer Landscape
- 11.1 Customer landscape overview
- Analysis of price sensitivity, lifecycle, customer purchase basket, adoption rates, and purchase criteria
12 Geographic Landscape
- 12.1 Geographic segmentation
- Chart on Market share by geography 2024-2029 (%)
- Data Table on Market share by geography 2024-2029 (%)
- 12.2 Geographic comparison
- Chart on Geographic comparison
- Data Table on Geographic comparison
- 12.3 APAC - Market size and forecast 2024-2029
- Chart on APAC - Market size and forecast 2024-2029 ($ billion)
- Data Table on APAC - Market size and forecast 2024-2029 ($ billion)
- Chart on APAC - Year-over-year growth 2024-2029 (%)
- Data Table on APAC - Year-over-year growth 2024-2029 (%)
- 12.4 Europe - Market size and forecast 2024-2029
- Chart on Europe - Market size and forecast 2024-2029 ($ billion)
- Data Table on Europe - Market size and forecast 2024-2029 ($ billion)
- Chart on Europe - Year-over-year growth 2024-2029 (%)
- Data Table on Europe - Year-over-year growth 2024-2029 (%)
- 12.5 North America - Market size and forecast 2024-2029
- Chart on North America - Market size and forecast 2024-2029 ($ billion)
- Data Table on North America - Market size and forecast 2024-2029 ($ billion)
- Chart on North America - Year-over-year growth 2024-2029 (%)
- Data Table on North America - Year-over-year growth 2024-2029 (%)
- 12.6 South America - Market size and forecast 2024-2029
- Chart on South America - Market size and forecast 2024-2029 ($ billion)
- Data Table on South America - Market size and forecast 2024-2029 ($ billion)
- Chart on South America - Year-over-year growth 2024-2029 (%)
- Data Table on South America - Year-over-year growth 2024-2029 (%)
- 12.7 Middle East and Africa - Market size and forecast 2024-2029
- Chart on Middle East and Africa - Market size and forecast 2024-2029 ($ billion)
- Data Table on Middle East and Africa - Market size and forecast 2024-2029 ($ billion)
- Chart on Middle East and Africa - Year-over-year growth 2024-2029 (%)
- Data Table on Middle East and Africa - Year-over-year growth 2024-2029 (%)
- 12.8 US - Market size and forecast 2024-2029
- Chart on US - Market size and forecast 2024-2029 ($ billion)
- Data Table on US - Market size and forecast 2024-2029 ($ billion)
- Chart on US - Year-over-year growth 2024-2029 (%)
- Data Table on US - Year-over-year growth 2024-2029 (%)
- 12.9 Germany - Market size and forecast 2024-2029
- Chart on Germany - Market size and forecast 2024-2029 ($ billion)
- Data Table on Germany - Market size and forecast 2024-2029 ($ billion)
- Chart on Germany - Year-over-year growth 2024-2029 (%)
- Data Table on Germany - Year-over-year growth 2024-2029 (%)
- 12.10 China - Market size and forecast 2024-2029
- Chart on China - Market size and forecast 2024-2029 ($ billion)
- Data Table on China - Market size and forecast 2024-2029 ($ billion)
- Chart on China - Year-over-year growth 2024-2029 (%)
- Data Table on China - Year-over-year growth 2024-2029 (%)
- 12.11 Italy - Market size and forecast 2024-2029
- Chart on Italy - Market size and forecast 2024-2029 ($ billion)
- Data Table on Italy - Market size and forecast 2024-2029 ($ billion)
- Chart on Italy - Year-over-year growth 2024-2029 (%)
- Data Table on Italy - Year-over-year growth 2024-2029 (%)
- 12.12 Australia - Market size and forecast 2024-2029
- Chart on Australia - Market size and forecast 2024-2029 ($ billion)
- Data Table on Australia - Market size and forecast 2024-2029 ($ billion)
- Chart on Australia - Year-over-year growth 2024-2029 (%)
- Data Table on Australia - Year-over-year growth 2024-2029 (%)
- 12.13 Canada - Market size and forecast 2024-2029
- Chart on Canada - Market size and forecast 2024-2029 ($ billion)
- Data Table on Canada - Market size and forecast 2024-2029 ($ billion)
- Chart on Canada - Year-over-year growth 2024-2029 (%)
- Data Table on Canada - Year-over-year growth 2024-2029 (%)
- 12.14 India - Market size and forecast 2024-2029
- Chart on India - Market size and forecast 2024-2029 ($ billion)
- Data Table on India - Market size and forecast 2024-2029 ($ billion)
- Chart on India - Year-over-year growth 2024-2029 (%)
- Data Table on India - Year-over-year growth 2024-2029 (%)
- 12.15 UK - Market size and forecast 2024-2029
- Chart on UK - Market size and forecast 2024-2029 ($ billion)
- Data Table on UK - Market size and forecast 2024-2029 ($ billion)
- Chart on UK - Year-over-year growth 2024-2029 (%)
- Data Table on UK - Year-over-year growth 2024-2029 (%)
- 12.16 Japan - Market size and forecast 2024-2029
- Chart on Japan - Market size and forecast 2024-2029 ($ billion)
- Data Table on Japan - Market size and forecast 2024-2029 ($ billion)
- Chart on Japan - Year-over-year growth 2024-2029 (%)
- Data Table on Japan - Year-over-year growth 2024-2029 (%)
- 12.17 France - Market size and forecast 2024-2029
- Chart on France - Market size and forecast 2024-2029 ($ billion)
- Data Table on France - Market size and forecast 2024-2029 ($ billion)
- Chart on France - Year-over-year growth 2024-2029 (%)
- Data Table on France - Year-over-year growth 2024-2029 (%)
- 12.18 Market opportunity by geography
- Market opportunity by geography ($ billion)
- Data Tables on Market opportunity by geography ($ billion)
13 Drivers, Challenges, and Opportunity/Restraints
- 13.3 Impact of drivers and challenges
- Impact of drivers and challenges in 2024 and 2029
- 13.4 Market opportunities/restraints
14 Competitive Landscape
- 14.2 Competitive Landscape
- Overview on criticality of inputs and factors of differentiation
- 14.3 Landscape disruption
- Overview on factors of disruption
- 14.4 Industry risks
- Impact of key risks on business
15 Competitive Analysis
- 15.2 Company ranking index
- 15.3 Market positioning of companies
- Matrix on companies position and classification
- 888 Holdings Plc
- 888 Holdings Plc - Overview
- 888 Holdings Plc - Business segments
- 888 Holdings Plc - Key offerings
- 888 Holdings Plc - Segment focus
- SWOT
- 15.5 Bet365 Group Ltd.
- Bet365 Group Ltd. - Overview
- Bet365 Group Ltd. - Product / Service
- Bet365 Group Ltd. - Key offerings
- SWOT
- 15.6 BetOnline
- BetOnline - Overview
- BetOnline - Product / Service
- BetOnline - Key offerings
- SWOT
- 15.7 Betsson AB
- Betsson AB - Overview
- Betsson AB - Product / Service
- Betsson AB - Key offerings
- SWOT
- 15.8 Caesars Entertainment Inc.
- Caesars Entertainment Inc. - Overview
- Caesars Entertainment Inc. - Business segments
- Caesars Entertainment Inc. - Key offerings
- Caesars Entertainment Inc. - Segment focus
- SWOT
- 15.9 Churchill Downs Inc.
- Churchill Downs Inc. - Overview
- Churchill Downs Inc. - Business segments
- Churchill Downs Inc. - Key offerings
- Churchill Downs Inc. - Segment focus
- SWOT
- 15.10 DraftKings Inc.
- DraftKings Inc. - Overview
- DraftKings Inc. - Business segments
- DraftKings Inc. - Key offerings
- DraftKings Inc. - Segment focus
- SWOT
- 15.11 Entain Plc
- Entain Plc - Overview
- Entain Plc - Business segments
- Entain Plc - Key offerings
- Entain Plc - Segment focus
- SWOT
- 15.12 Flutter Entertainment Plc
- Flutter Entertainment Plc - Overview
- Flutter Entertainment Plc - Business segments
- Flutter Entertainment Plc - Key offerings
- Flutter Entertainment Plc - Segment focus
- SWOT
- 15.13 Kindred Group Plc
- Kindred Group Plc - Overview
- Kindred Group Plc - Business segments
- Kindred Group Plc - Key offerings
- Kindred Group Plc - Segment focus
- SWOT
- 15.14 LeoVegas AB
- LeoVegas AB - Overview
- LeoVegas AB - Product / Service
- LeoVegas AB - Key offerings
- SWOT
- 15.15 Penn Entertainment Inc.
- Penn Entertainment Inc. - Overview
- Penn Entertainment Inc. - Product / Service
- Penn Entertainment Inc. - Key offerings
- SWOT
- 15.16 Sportech Plc
- Sportech Plc - Overview
- Sportech Plc - Product / Service
- Sportech Plc - Key offerings
- SWOT
- 15.17 The Betway Group
- The Betway Group - Overview
- The Betway Group - Product / Service
- The Betway Group - Key offerings
- SWOT
- 15.18 The Hong Kong Jockey Club
- The Hong Kong Jockey Club - Overview
- The Hong Kong Jockey Club - Product / Service
- The Hong Kong Jockey Club - Key offerings
- SWOT
16 Appendix
- 16.2 Inclusions and exclusions checklist
- Inclusions checklist
- Exclusions checklist
- 16.3 Currency conversion rates for US$
- Currency conversion rates for US$
- 16.4 Research methodology
- 16.7 Validation techniques employed for market sizing
- Validation techniques employed for market sizing
- 16.9 360 degree market analysis
- 360 degree market analysis
- 16.10 List of abbreviations
Research Framework
Technavio presents a detailed picture of the market by way of study, synthesis, and summation of data from multiple sources. The analysts have presented the various facets of the market with a particular focus on identifying the key industry influencers. The data thus presented is comprehensive, reliable, and the result of extensive research, both primary and secondary.
 INFORMATION SOURCES
Primary sources
- Manufacturers and suppliers
- Channel partners
- Industry experts
- Strategic decision makers
Secondary sources
- Industry journals and periodicals
- Government data
- Financial reports of key industry players
- Historical data
- Press releases

 DATA ANALYSIS
Data Synthesis
- Collation of data
- Estimation of key figures
- Analysis of derived insights
Data Validation
- Triangulation with data models
- Reference against proprietary databases
- Corroboration with industry experts
 REPORT WRITING
Qualitative
- Market drivers
- Market challenges
- Market trends
- Five forces analysis
Quantitative
- Market size and forecast
- Market segmentation
- Geographical insights
- Competitive landscape


