Industrial Hemp Market Size 2025-2029
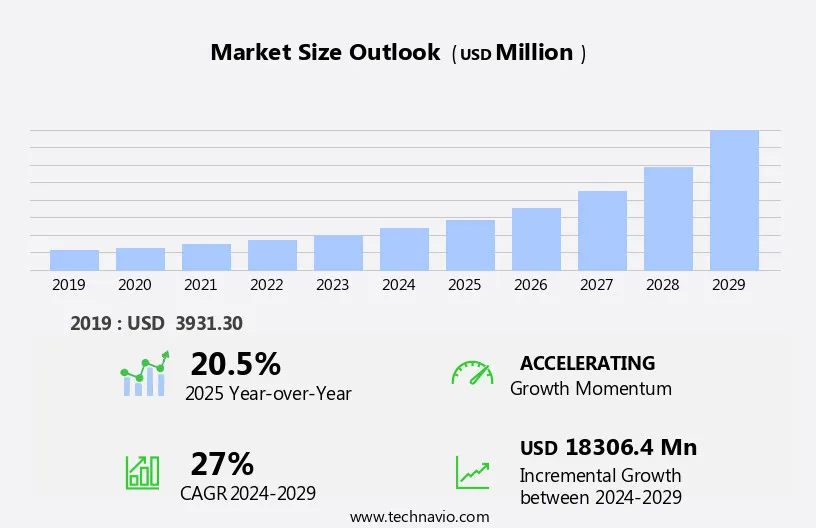
The industrial hemp market size is forecast to increase by USD 18.31 billion at a CAGR of 27% between 2024 and 2029.
- The market is experiencing significant growth, driven primarily by the burgeoning textile industry's increasing demand for hemp-derived products. Hemp fibers are increasingly being used in textiles and composite materials, while hempseed oil is gaining popularity in the food and pharmaceutical sectors. The versatile nature of hemp, with its applications ranging from textiles to construction materials, food, and industrial uses, is fueling this demand. Furthermore, strategic collaborations, partnerships, and mergers and acquisitions are on the rise in the market, as companies seek to strengthen their positions and capitalize on the opportunities presented by this growing industry.
- However, the production of hemp poses challenges, including complex cultivation processes, regulatory compliance, and competition from synthetic alternatives. Addressing these challenges will be crucial for companies looking to effectively capitalize on the market's potential and maintain a competitive edge.
What will be the Size of the Industrial Hemp Market during the forecast period?
Request Free Sample
1 Executive Summary
- 1.1 Market overview
- Executive Summary - Chart on Market Overview
- Executive Summary - Data Table on Market Overview
- Executive Summary - Chart on Global Market Characteristics
- Executive Summary - Chart on Market by Geography
- Executive Summary - Chart on Market Segmentation by Product
- Executive Summary - Chart on Market Segmentation by Application
- Executive Summary - Chart on Incremental Growth
- Executive Summary - Data Table on Incremental Growth
- Executive Summary - Chart on Company Market Positioning
2 Technavio Analysis
- 2.1 Analysis of price sensitivity, lifecycle, customer purchase basket, adoption rates, and purchase criteria
- Analysis of price sensitivity, lifecycle, customer purchase basket, adoption rates, and purchase criteria
- 2.2 Criticality of inputs and Factors of differentiation
- Overview on criticality of inputs and factors of differentiation
- 2.3 Factors of disruption
- Overview on factors of disruption
- 2.4 Impact of drivers and challenges
- Impact of drivers and challenges in 2024 and 2029
3 Market Landscape
- 3.1 Market ecosystem
- Parent Market
- Data Table on - Parent Market
- 3.2 Market characteristics
- Market characteristics analysis
4 Market Sizing
- 4.1 Market definition
- Offerings of companies included in the market definition
- 4.2 Market segment analysis
- 4.4 Market outlook: Forecast for 2024-2029
- Chart on Global - Market size and forecast 2024-2029 ($ million)
- Data Table on Global - Market size and forecast 2024-2029 ($ million)
- Chart on Global Market: Year-over-year growth 2024-2029 (%)
- Data Table on Global Market: Year-over-year growth 2024-2029 (%)
5 Historic Market Size
- 5.1 Global Industrial Hemp Market 2019 - 2023
- Historic Market Size - Data Table on Global Industrial Hemp Market 2019 - 2023 ($ million)
- 5.2 Product segment analysis 2019 - 2023
- Historic Market Size - Product Segment 2019 - 2023 ($ million)
- 5.3 Application segment analysis 2019 - 2023
- Historic Market Size - Application Segment 2019 - 2023 ($ million)
- 5.4 Geography segment analysis 2019 - 2023
- Historic Market Size - Geography Segment 2019 - 2023 ($ million)
- 5.5 Country segment analysis 2019 - 2023
- Historic Market Size - Country Segment 2019 - 2023 ($ million)
6 Qualitative Analysis
- 6.1 Impact of AI in the Global Industrial Hemp Market
7 Five Forces Analysis
- 7.1 Five forces summary
- Five forces analysis - Comparison between 2024 and 2029
- 7.2 Bargaining power of buyers
- Bargaining power of buyers - Impact of key factors 2024 and 2029
- 7.3 Bargaining power of suppliers
- Bargaining power of suppliers - Impact of key factors in 2024 and 2029
- 7.4 Threat of new entrants
- Threat of new entrants - Impact of key factors in 2024 and 2029
- 7.5 Threat of substitutes
- Threat of substitutes - Impact of key factors in 2024 and 2029
- 7.6 Threat of rivalry
- Threat of rivalry - Impact of key factors in 2024 and 2029
- 7.7 Market condition
- Chart on Market condition - Five forces 2024 and 2029
8 Market Segmentation by Product
- 8.1 Market segments
- Chart on Product - Market share (2024-2029) (%)
- Data Table on Product - Market share (2024-2029) (%)
- 8.2 Comparison by Product
- Chart on Comparison by Product
- Data Table on Comparison by Product
- 8.3 Seeds - Market size and forecast (2024-2029)
- Chart on Seeds - Market size and forecast (2024-2029) ($ million)
- Data Table on Seeds - Market size and forecast (2024-2029) ($ million)
- Chart on Seeds - Year-over-year growth (2024-2029) (%)
- Data Table on Seeds - Year-over-year growth (2024-2029) (%)
- 8.4 Fiber - Market size and forecast (2024-2029)
- Chart on Fiber - Market size and forecast (2024-2029) ($ million)
- Data Table on Fiber - Market size and forecast (2024-2029) ($ million)
- Chart on Fiber - Year-over-year growth (2024-2029) (%)
- Data Table on Fiber - Year-over-year growth (2024-2029) (%)
- 8.5 Shivs - Market size and forecast (2024-2029)
- Chart on Shivs - Market size and forecast (2024-2029) ($ million)
- Data Table on Shivs - Market size and forecast (2024-2029) ($ million)
- Chart on Shivs - Year-over-year growth (2024-2029) (%)
- Data Table on Shivs - Year-over-year growth (2024-2029) (%)
- 8.6 Market opportunity by Product
- Market opportunity by Product ($ million)
- Data Table on Market opportunity by Product ($ million)
9 Market Segmentation by Application
- 9.1 Market segments
- Chart on Application - Market share (2024-2029) (%)
- Data Table on Application - Market share (2024-2029) (%)
- 9.2 Comparison by Application
- Chart on Comparison by Application
- Data Table on Comparison by Application
- 9.3 Textile - Market size and forecast (2024-2029)
- Chart on Textile - Market size and forecast (2024-2029) ($ million)
- Data Table on Textile - Market size and forecast (2024-2029) ($ million)
- Chart on Textile - Year-over-year growth (2024-2029) (%)
- Data Table on Textile - Year-over-year growth (2024-2029) (%)
- 9.4 Food and beverages - Market size and forecast (2024-2029)
- Chart on Food and beverages - Market size and forecast (2024-2029) ($ million)
- Data Table on Food and beverages - Market size and forecast (2024-2029) ($ million)
- Chart on Food and beverages - Year-over-year growth (2024-2029) (%)
- Data Table on Food and beverages - Year-over-year growth (2024-2029) (%)
- 9.5 Personal care - Market size and forecast (2024-2029)
- Chart on Personal care - Market size and forecast (2024-2029) ($ million)
- Data Table on Personal care - Market size and forecast (2024-2029) ($ million)
- Chart on Personal care - Year-over-year growth (2024-2029) (%)
- Data Table on Personal care - Year-over-year growth (2024-2029) (%)
- 9.6 Animal care - Market size and forecast (2024-2029)
- Chart on Animal care - Market size and forecast (2024-2029) ($ million)
- Data Table on Animal care - Market size and forecast (2024-2029) ($ million)
- Chart on Animal care - Year-over-year growth (2024-2029) (%)
- Data Table on Animal care - Year-over-year growth (2024-2029) (%)
- 9.7 Others - Market size and forecast (2024-2029)
- Chart on Others - Market size and forecast (2024-2029) ($ million)
- Data Table on Others - Market size and forecast (2024-2029) ($ million)
- Chart on Others - Year-over-year growth (2024-2029) (%)
- Data Table on Others - Year-over-year growth (2024-2029) (%)
- 9.8 Market opportunity by Application
- Market opportunity by Application ($ million)
- Data Table on Market opportunity by Application ($ million)
10 Market Segmentation by Source
- 10.1 Market segments
- Chart on Source - Market share (2024-2029) (%)
- Data Table on Source - Market share (2024-2029) (%)
- 10.2 Comparison by Source
- Chart on Comparison by Source
- Data Table on Comparison by Source
- 10.3 Organic - Market size and forecast (2024-2029)
- Chart on Organic - Market size and forecast (2024-2029) ($ million)
- Data Table on Organic - Market size and forecast (2024-2029) ($ million)
- Chart on Organic - Year-over-year growth (2024-2029) (%)
- Data Table on Organic - Year-over-year growth (2024-2029) (%)
- 10.4 Conventional - Market size and forecast (2024-2029)
- Chart on Conventional - Market size and forecast (2024-2029) ($ million)
- Data Table on Conventional - Market size and forecast (2024-2029) ($ million)
- Chart on Conventional - Year-over-year growth (2024-2029) (%)
- Data Table on Conventional - Year-over-year growth (2024-2029) (%)
- 10.5 Market opportunity by Source
- Market opportunity by Source ($ million)
- Data Table on Market opportunity by Source ($ million)
11 Customer Landscape
- 11.1 Customer landscape overview
- Analysis of price sensitivity, lifecycle, customer purchase basket, adoption rates, and purchase criteria
12 Geographic Landscape
- 12.1 Geographic segmentation
- Chart on Market share by geography 2024-2029 (%)
- Data Table on Market share by geography 2024-2029 (%)
- 12.2 Geographic comparison
- Chart on Geographic comparison
- Data Table on Geographic comparison
- 12.3 APAC - Market size and forecast 2024-2029
- Chart on APAC - Market size and forecast 2024-2029 ($ million)
- Data Table on APAC - Market size and forecast 2024-2029 ($ million)
- Chart on APAC - Year-over-year growth 2024-2029 (%)
- Data Table on APAC - Year-over-year growth 2024-2029 (%)
- 12.4 North America - Market size and forecast 2024-2029
- Chart on North America - Market size and forecast 2024-2029 ($ million)
- Data Table on North America - Market size and forecast 2024-2029 ($ million)
- Chart on North America - Year-over-year growth 2024-2029 (%)
- Data Table on North America - Year-over-year growth 2024-2029 (%)
- 12.5 Europe - Market size and forecast 2024-2029
- Chart on Europe - Market size and forecast 2024-2029 ($ million)
- Data Table on Europe - Market size and forecast 2024-2029 ($ million)
- Chart on Europe - Year-over-year growth 2024-2029 (%)
- Data Table on Europe - Year-over-year growth 2024-2029 (%)
- 12.6 South America - Market size and forecast 2024-2029
- Chart on South America - Market size and forecast 2024-2029 ($ million)
- Data Table on South America - Market size and forecast 2024-2029 ($ million)
- Chart on South America - Year-over-year growth 2024-2029 (%)
- Data Table on South America - Year-over-year growth 2024-2029 (%)
- 12.7 Middle East and Africa - Market size and forecast 2024-2029
- Chart on Middle East and Africa - Market size and forecast 2024-2029 ($ million)
- Data Table on Middle East and Africa - Market size and forecast 2024-2029 ($ million)
- Chart on Middle East and Africa - Year-over-year growth 2024-2029 (%)
- Data Table on Middle East and Africa - Year-over-year growth 2024-2029 (%)
- 12.8 US - Market size and forecast 2024-2029
- Chart on US - Market size and forecast 2024-2029 ($ million)
- Data Table on US - Market size and forecast 2024-2029 ($ million)
- Chart on US - Year-over-year growth 2024-2029 (%)
- Data Table on US - Year-over-year growth 2024-2029 (%)
- 12.9 China - Market size and forecast 2024-2029
- Chart on China - Market size and forecast 2024-2029 ($ million)
- Data Table on China - Market size and forecast 2024-2029 ($ million)
- Chart on China - Year-over-year growth 2024-2029 (%)
- Data Table on China - Year-over-year growth 2024-2029 (%)
- 12.10 Canada - Market size and forecast 2024-2029
- Chart on Canada - Market size and forecast 2024-2029 ($ million)
- Data Table on Canada - Market size and forecast 2024-2029 ($ million)
- Chart on Canada - Year-over-year growth 2024-2029 (%)
- Data Table on Canada - Year-over-year growth 2024-2029 (%)
- 12.11 Germany - Market size and forecast 2024-2029
- Chart on Germany - Market size and forecast 2024-2029 ($ million)
- Data Table on Germany - Market size and forecast 2024-2029 ($ million)
- Chart on Germany - Year-over-year growth 2024-2029 (%)
- Data Table on Germany - Year-over-year growth 2024-2029 (%)
- 12.12 Japan - Market size and forecast 2024-2029
- Chart on Japan - Market size and forecast 2024-2029 ($ million)
- Data Table on Japan - Market size and forecast 2024-2029 ($ million)
- Chart on Japan - Year-over-year growth 2024-2029 (%)
- Data Table on Japan - Year-over-year growth 2024-2029 (%)
- 12.13 UK - Market size and forecast 2024-2029
- Chart on UK - Market size and forecast 2024-2029 ($ million)
- Data Table on UK - Market size and forecast 2024-2029 ($ million)
- Chart on UK - Year-over-year growth 2024-2029 (%)
- Data Table on UK - Year-over-year growth 2024-2029 (%)
- 12.14 India - Market size and forecast 2024-2029
- Chart on India - Market size and forecast 2024-2029 ($ million)
- Data Table on India - Market size and forecast 2024-2029 ($ million)
- Chart on India - Year-over-year growth 2024-2029 (%)
- Data Table on India - Year-over-year growth 2024-2029 (%)
- 12.15 South Korea - Market size and forecast 2024-2029
- Chart on South Korea - Market size and forecast 2024-2029 ($ million)
- Data Table on South Korea - Market size and forecast 2024-2029 ($ million)
- Chart on South Korea - Year-over-year growth 2024-2029 (%)
- Data Table on South Korea - Year-over-year growth 2024-2029 (%)
- 12.16 France - Market size and forecast 2024-2029
- Chart on France - Market size and forecast 2024-2029 ($ million)
- Data Table on France - Market size and forecast 2024-2029 ($ million)
- Chart on France - Year-over-year growth 2024-2029 (%)
- Data Table on France - Year-over-year growth 2024-2029 (%)
- 12.17 Italy - Market size and forecast 2024-2029
- Chart on Italy - Market size and forecast 2024-2029 ($ million)
- Data Table on Italy - Market size and forecast 2024-2029 ($ million)
- Chart on Italy - Year-over-year growth 2024-2029 (%)
- Data Table on Italy - Year-over-year growth 2024-2029 (%)
- 12.18 Market opportunity by geography
- Market opportunity by geography ($ million)
- Data Tables on Market opportunity by geography ($ million)
- 12.19 Brazil - Market size and forecast (2024-2029)
- Chart on Brazil - Market size and forecast (2024-2029) ($ million)
- Data Table on Brazil - Market size and forecast (2024-2029) ($ million)
- Chart on Brazil - Year-over-year growth (2024-2029) (%)
- Data Table on Brazil - Year-over-year growth (2024-2029) (%)
- 12.20 Egypt - Market size and forecast (2024-2029)
- Chart on Egypt - Market size and forecast (2024-2029) ($ million)
- Data Table on Egypt - Market size and forecast (2024-2029) ($ million)
- Chart on Egypt - Year-over-year growth (2024-2029) (%)
- Data Table on Egypt - Year-over-year growth (2024-2029) (%)
- 12.21 UAE - Market size and forecast (2024-2029)
- Chart on UAE - Market size and forecast (2024-2029) ($ million)
- Data Table on UAE - Market size and forecast (2024-2029) ($ million)
- Chart on UAE - Year-over-year growth (2024-2029) (%)
- Data Table on UAE - Year-over-year growth (2024-2029) (%)
- 12.22 Oman - Market size and forecast (2024-2029)
- Chart on Oman - Market size and forecast (2024-2029) ($ million)
- Data Table on Oman - Market size and forecast (2024-2029) ($ million)
- Chart on Oman - Year-over-year growth (2024-2029) (%)
- Data Table on Oman - Year-over-year growth (2024-2029) (%)
- 12.23 Argentina - Market size and forecast (2024-2029)
- Chart on Argentina - Market size and forecast (2024-2029) ($ million)
- Data Table on Argentina - Market size and forecast (2024-2029) ($ million)
- Chart on Argentina - Year-over-year growth (2024-2029) (%)
- Data Table on Argentina - Year-over-year growth (2024-2029) (%)
- 12.24 KSA - Market size and forecast (2024-2029)
- Chart on KSA - Market size and forecast (2024-2029) ($ million)
- Data Table on KSA - Market size and forecast (2024-2029) ($ million)
- Chart on KSA - Year-over-year growth (2024-2029) (%)
- Data Table on KSA - Year-over-year growth (2024-2029) (%)
- 12.25 UAE - Market size and forecast (2024-2029)
- Chart on UAE - Market size and forecast (2024-2029) ($ million)
- Data Table on UAE - Market size and forecast (2024-2029) ($ million)
- Chart on UAE - Year-over-year growth (2024-2029) (%)
- Data Table on UAE - Year-over-year growth (2024-2029) (%)
- 12.26 Brazil - Market size and forecast (2024-2029)
- Chart on Brazil - Market size and forecast (2024-2029) ($ million)
- Data Table on Brazil - Market size and forecast (2024-2029) ($ million)
- Chart on Brazil - Year-over-year growth (2024-2029) (%)
- Data Table on Brazil - Year-over-year growth (2024-2029) (%)
- 12.27 Rest of World (ROW) - Market size and forecast (2024-2029)
- Chart on Rest of World (ROW) - Market size and forecast (2024-2029) ($ million)
- Data Table on Rest of World (ROW) - Market size and forecast (2024-2029) ($ million)
- Chart on Rest of World (ROW) - Year-over-year growth (2024-2029) (%)
- Data Table on Rest of World (ROW) - Year-over-year growth (2024-2029) (%)
13 Drivers, Challenges, and Opportunity/Restraints
- 13.3 Impact of drivers and challenges
- Impact of drivers and challenges in 2024 and 2029
- 13.4 Market opportunities/restraints
14 Competitive Landscape
- 14.2 Competitive Landscape
- Overview on criticality of inputs and factors of differentiation
- 14.3 Landscape disruption
- Overview on factors of disruption
- 14.4 Industry risks
- Impact of key risks on business
15 Competitive Analysis
- 15.2 Market positioning of companies
- Matrix on companies position and classification
- 15.3 Bast Fibre Technologies Inc.
- Bast Fibre Technologies Inc. - Overview
- Bast Fibre Technologies Inc. - Product / Service
- Bast Fibre Technologies Inc. - Key offerings
- 15.4 Bazelet Nehushtan Ltd.
- Bazelet Nehushtan Ltd. - Overview
- Bazelet Nehushtan Ltd. - Product / Service
- Bazelet Nehushtan Ltd. - Key offerings
- 15.5 Canopy Growth Corporation
- Canopy Growth Corporation - Overview
- Canopy Growth Corporation - Product / Service
- Canopy Growth Corporation - Key offerings
- 15.6 Cavabien SA
- Cavabien SA - Overview
- Cavabien SA - Product / Service
- Cavabien SA - Key offerings
- 15.7 Charlotte's Web Holdings, Inc.
- Charlotte's Web Holdings, Inc. - Overview
- Charlotte's Web Holdings, Inc. - Product / Service
- Charlotte's Web Holdings, Inc. - Key offerings
- 15.8 Ecofibre Limited
- Ecofibre Limited - Overview
- Ecofibre Limited - Product / Service
- Ecofibre Limited - Key offerings
- 15.9 GenCanna Global USA, Inc.
- GenCanna Global USA, Inc. - Overview
- GenCanna Global USA, Inc. - Product / Service
- GenCanna Global USA, Inc. - Key offerings
- 15.10 HempFlax B.V.
- HempFlax B.V. - Overview
- HempFlax B.V. - Product / Service
- HempFlax B.V. - Key offerings
- 15.11 HemPoland Sp. z o.o.
- HemPoland Sp. z o.o. - Overview
- HemPoland Sp. z o.o. - Product / Service
- HemPoland Sp. z o.o. - Key offerings
- 15.12 Konopie Polska Sp. z o.o.
- Konopie Polska Sp. z o.o. - Overview
- Konopie Polska Sp. z o.o. - Product / Service
- Konopie Polska Sp. z o.o. - Key offerings
- 15.13 Naturally Splendid Enterprises Ltd.
- Naturally Splendid Enterprises Ltd. - Overview
- Naturally Splendid Enterprises Ltd. - Product / Service
- Naturally Splendid Enterprises Ltd. - Key offerings
- 15.14 Navitas Organics
- Navitas Organics - Overview
- Navitas Organics - Product / Service
- Navitas Organics - Key offerings
- 15.15 Nutiva Inc.
- Nutiva Inc. - Overview
- Nutiva Inc. - Product / Service
- Nutiva Inc. - Key offerings
- 15.16 South Hemp Tecno S.r.l.
- South Hemp Tecno S.r.l. - Overview
- South Hemp Tecno S.r.l. - Product / Service
- South Hemp Tecno S.r.l. - Key offerings
- 15.17 TerraFarma (Hexo Corp.)
- TerraFarma (Hexo Corp.) - Overview
- TerraFarma (Hexo Corp.) - Product / Service
- TerraFarma (Hexo Corp.) - Key offerings
- 15.18 The Yield Growth Corp.
- The Yield Growth Corp. - Overview
- The Yield Growth Corp. - Product / Service
- The Yield Growth Corp. - Key offerings
- 15.19 Tilray Brands, Inc.
- Tilray Brands, Inc. - Overview
- Tilray Brands, Inc. - Product / Service
- Tilray Brands, Inc. - Key offerings
- 15.20 United Cannabis Corporation
- United Cannabis Corporation - Overview
- United Cannabis Corporation - Product / Service
- United Cannabis Corporation - Key offerings
- 15.21 Valens Groworks Corp.
- Valens Groworks Corp. - Overview
- Valens Groworks Corp. - Product / Service
- Valens Groworks Corp. - Key offerings
- 15.22 WeedMD Inc.
- WeedMD Inc. - Overview
- WeedMD Inc. - Product / Service
- WeedMD Inc. - Key offerings
- 15.23 Aurora Cannabis Inc.
- Aurora Cannabis Inc. - Overview
- Aurora Cannabis Inc. - Product / Service
- Aurora Cannabis Inc. - Key offerings
- 15.24 Bombay Hemp Co. Pvt. Ltd.
- Bombay Hemp Co. Pvt. Ltd. - Overview
- Bombay Hemp Co. Pvt. Ltd. - Product / Service
- Bombay Hemp Co. Pvt. Ltd. - Key offerings
- 15.25 Boring Hemp Co.
- Boring Hemp Co. - Overview
- Boring Hemp Co. - Product / Service
- Boring Hemp Co. - Key offerings
- 15.26 Canopy Growth Corp.
- Canopy Growth Corp. - Overview
- Canopy Growth Corp. - Product / Service
- Canopy Growth Corp. - Key offerings
- 15.27 Charlottes Web Holdings Inc.
- Charlottes Web Holdings Inc. - Overview
- Charlottes Web Holdings Inc. - Product / Service
- Charlottes Web Holdings Inc. - Key offerings
- 15.28 CV Sciences Inc.
- CV Sciences Inc. - Overview
- CV Sciences Inc. - Product / Service
- CV Sciences Inc. - Key offerings
- 15.29 Deep Nature Project GmbH
- Deep Nature Project GmbH - Overview
- Deep Nature Project GmbH - Product / Service
- Deep Nature Project GmbH - Key offerings
- 15.30 Dun Agro Hemp Group
- Dun Agro Hemp Group - Overview
- Dun Agro Hemp Group - Product / Service
- Dun Agro Hemp Group - Key offerings
- 15.31 Ecofibre Ltd.
- Ecofibre Ltd. - Overview
- Ecofibre Ltd. - Product / Service
- Ecofibre Ltd. - Key offerings
- 15.32 Elixinol Wellness Ltd.
- Elixinol Wellness Ltd. - Overview
- Elixinol Wellness Ltd. - Product / Service
- Elixinol Wellness Ltd. - Key offerings
- 15.33 GFR Ingredients Ltd.
- GFR Ingredients Ltd. - Overview
- GFR Ingredients Ltd. - Product / Service
- GFR Ingredients Ltd. - Key offerings
- 15.34 Hanma Investment Group Co. Ltd.
- Hanma Investment Group Co. Ltd. - Overview
- Hanma Investment Group Co. Ltd. - Product / Service
- Hanma Investment Group Co. Ltd. - Key offerings
- 15.35 Hemp Horizons Private Ltd.
- Hemp Horizons Private Ltd. - Overview
- Hemp Horizons Private Ltd. - Product / Service
- Hemp Horizons Private Ltd. - Key offerings
- 15.36 HempFlax Group BV
- HempFlax Group BV - Overview
- HempFlax Group BV - Product / Service
- HempFlax Group BV - Key offerings
- 15.37 HemPoland Sp zoo
- HemPoland Sp zoo - Overview
- HemPoland Sp zoo - Product / Service
- HemPoland Sp zoo - Key offerings
- 15.38 Liaoning Qiaopai Biotech Co. Ltd.
- Liaoning Qiaopai Biotech Co. Ltd. - Overview
- Liaoning Qiaopai Biotech Co. Ltd. - Product / Service
- Liaoning Qiaopai Biotech Co. Ltd. - Key offerings
- 15.39 Medical Marijuana Inc.
- Medical Marijuana Inc. - Overview
- Medical Marijuana Inc. - Product / Service
- Medical Marijuana Inc. - Key offerings
- 15.40 Nutiva Inc.
- Nutiva Inc. - Overview
- Nutiva Inc. - Product / Service
- Nutiva Inc. - Key offerings
- 15.41 Parkland Industrial Hemp Growers Co op. Ltd.
- Parkland Industrial Hemp Growers Co op. Ltd. - Overview
- Parkland Industrial Hemp Growers Co op. Ltd. - Product / Service
- Parkland Industrial Hemp Growers Co op. Ltd. - Key offerings
- 15.42 Tilray Brands Inc.
- Tilray Brands Inc. - Overview
- Tilray Brands Inc. - Product / Service
- Tilray Brands Inc. - Key offerings
16 Appendix
- 16.2 Inclusions and exclusions checklist
- Inclusions checklist
- Exclusions checklist
- 16.3 Currency conversion rates for US$
- Currency conversion rates for US$
- 16.4 Research methodology
- 16.7 Validation techniques employed for market sizing
- Validation techniques employed for market sizing
- 16.9 360 degree market analysis
- 360 degree market analysis
- 16.10 List of abbreviations
Research Framework
Technavio presents a detailed picture of the market by way of study, synthesis, and summation of data from multiple sources. The analysts have presented the various facets of the market with a particular focus on identifying the key industry influencers. The data thus presented is comprehensive, reliable, and the result of extensive research, both primary and secondary.
 INFORMATION SOURCES
Primary sources
- Manufacturers and suppliers
- Channel partners
- Industry experts
- Strategic decision makers
Secondary sources
- Industry journals and periodicals
- Government data
- Financial reports of key industry players
- Historical data
- Press releases

 DATA ANALYSIS
Data Synthesis
- Collation of data
- Estimation of key figures
- Analysis of derived insights
Data Validation
- Triangulation with data models
- Reference against proprietary databases
- Corroboration with industry experts
 REPORT WRITING
Qualitative
- Market drivers
- Market challenges
- Market trends
- Five forces analysis
Quantitative
- Market size and forecast
- Market segmentation
- Geographical insights
- Competitive landscape
, Europe (France, Germany, Italy, and UK), Middle East and Africa (Egypt, KSA, Oman, and UAE), APAC (China, India, and Japan), South America (Argentina and Brazil), and Rest of World (ROW)")

