Energy
Visualizing Copper’s Role in the Transition to Clean Energy
A future powered by renewables is not in the distant horizon, but rather in its early hours.
This new dawn comes from a global awareness of the environmental impacts of the current energy mix, which relies heavily on fossil fuels and their associated greenhouse gas emissions.
Technologies such as wind, solar, and batteries offer renewable and clean alternatives and are leading the way for the transition to clean energy. However, as with every energy transition, there are not only new technologies, but also new material demands.
Copper: A Key Piece of the Puzzle
This energy transition will be mineral intensive and it will require metals such as nickel, lithium, and cobalt. However, one metal stands out as being particularly important, and that is copper.
Today’s infographic comes to us from the Copper Development Association and outlines the special role of copper in renewable power generation, energy storage, and electric vehicles.

Why Copper?
The red metal has four key properties that make it ideal for the clean energy transition.
- Conductivity
- Ductility
- Efficiency
- Recyclability
It is these properties that make copper the critical material for wind and solar technology, energy storage, and electric vehicles.
It’s also why, according to ThinkCopper, the generation of electricity from solar and wind uses four to six times more copper than fossil fuel sources.
Copper in Wind
A three-megawatt wind turbine can contain up to 4.7 tons of copper with 53% of that demand coming from the cable and wiring, 24% from the turbine/power generation components, 4% from transformers, and 19% from turbine transformers.
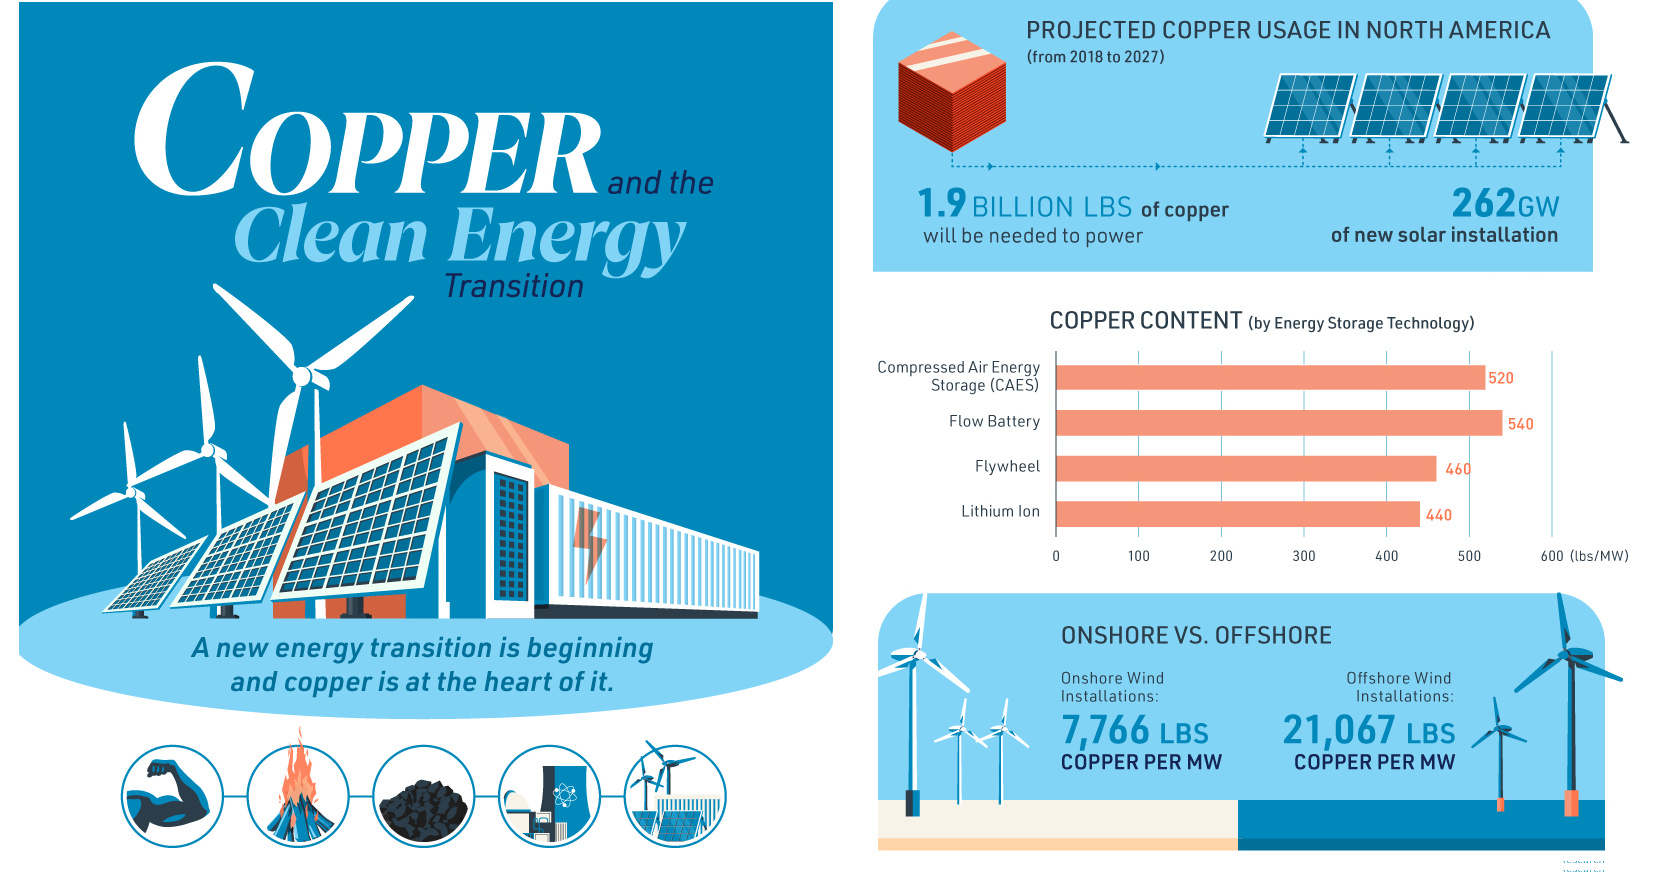
The use of copper significantly increases when going offshore. That’s because onshore wind farms use approximately 7,766 lbs of copper per MW, while an offshore wind installation uses 21,068 lbs of copper per MW.
It is the cabling of the offshore wind farms to connect them to each other and to deliver the power that accounts for the bulk of the copper usage.
Copper in Solar
Solar power systems can contain approximately 5.5 tons of copper per MW. Copper is in the heat exchangers of solar thermal units as well as in the wiring and cabling that transmits the electricity in photovoltaic solar cells.
Navigant Research projects that 262 GW of new solar installations between 2018 and 2027 in North America will require 1.9 billion lbs of copper.
Copper in Energy Storage
There are many ways to store energy, but every method uses copper. For example, a lithium ion battery contains 440 lbs of copper per MW and a flow battery 540 lbs of copper per MW.
Copper wiring and cabling connects renewable power generation with energy storage, while the copper in the switches of transformers help to deliver power at the right voltage.
Across the United States, a total of 5,752 MW of energy capacity has been announced and commissioned.
Copper in Electric Vehicles
Copper is at the heart of the electric vehicle (EV). This is because EVs rely on copper for the motor coil that drives the engine.
The more electric the car, the more copper it needs; a car powered by an internal combustion engine contains roughly 48 lbs, a hybrid needs 88 lbs, and a battery electric vehicle uses 184 lbs.
Additionally, the cabling for charging stations of electric vehicles will be another source of copper demand.
The Copper Future
Advances in technologies create new material demands.
Therefore, it shouldn’t be surprising that the transition to renewables is going to create demand for many minerals – and copper is going to be a critical mineral for the new era of energy.


Energy
Mapped: The Age of Energy Projects in Interconnection Queues, by State
This map shows how many energy projects are in interconnection queues by state and how long these projects have been queued up, on average.


Age of Energy Projects in Interconnection Queues, by State
This was originally posted on our Voronoi app. Download the app for free on iOS or Android and discover incredible data-driven charts from a variety of trusted sources.
By the end of 2023, more than 11,000 energy projects were in interconnection queues in the United States, waiting for a green-light from regional grid operators to proceed with construction.
This map, created in partnership with the National Public Utilities Council, maps out the average age of active energy projects in interconnection queues by state, using data from Berkeley Lab.
Interconnection Queues, Explained
Interconnection queues are lists of energy projects that have made interconnection requests to their regional grid operators. Once submitted, these requests formally initiate the impact study process that each project goes through before grid connection, forming waiting lists for approval known as interconnection queues.
In recent years, both the number and generation capacity of queued projects have surged in the United States, along with the length of time spent in queue.
According to Berkeley Lab, the amount of generation capacity entering queues each year has risen by more than 550% from 2015 to 2023, with average queue duration rising from 3 years to 5 years the same period.
As a result of the growing backlog, a large proportion of projects ultimately withdraw from queues, leading to only 19% of applications reaching commercial operations.
The Backlog: Number of Projects and Average Wait Times
Of the 11,000 active projects in U.S. queues at the end of 2023, Texas, California, and Virginia had the most in queue; 1,208, 947, and 743, respectively.
When looking at the average ages of these projects, all three states hovered around the national average of 34 months (2.83 years), with Texas sporting 28 months, California 33, and Virginia 34.
Vermont, Minnesota, Wisconsin, and Florida, on the other hand, had the highest average queue durations; 54, 49, 47, and 46 months, respectively.
Average Queue Duration by Project Type
At the end of 2023, more than 95% of the generation capacity in active interconnection queues was for emission-free resources. The table below provides a breakdown.
| Project Type | Average Queue Duration (As of 12/31/2023) | Number of Projects in Queue |
|---|---|---|
| Wind | 40 months | 841 |
| Solar | 34 months | 4,506 |
| Wind+Battery | 34 months | 76 |
| Solar+Battery | 27 months | 2,377 |
| Battery | 24 months | 2,818 |
Wind projects had the highest wait times at the end of 2023 with an average age of 40 months (3.33 years). Solar projects, on the other hand, made up more than 40% of projects in queue.
Overall, reducing the time that these renewable energy projects spend in queues can accelerate the transition to a low-carbon energy future.
According to the U.S. Department of Energy, enhancing data transparency, streamlining approval processes, promoting economic efficiency, and maintaining a reliable grid are some of the ways this growing backlog can be mitigated.

-

 Culture6 days ago
The World’s Top Media Franchises by All-Time Revenue
-

 Science2 weeks ago
Visualizing the Average Lifespans of Mammals
-

 Brands2 weeks ago
How Tech Logos Have Evolved Over Time
-

 Energy2 weeks ago
Ranked: The Top 10 EV Battery Manufacturers in 2023
-

 Countries2 weeks ago
Countries With the Largest Happiness Gains Since 2010
-

 Economy2 weeks ago
VC+: Get Our Key Takeaways From the IMF’s World Economic Outlook
-

 Demographics2 weeks ago
The Countries That Have Become Sadder Since 2010
-

 Money1 week ago
Charted: Who Has Savings in This Economy?